Showing posts with label Special Teams. Show all posts

Monday, April 19, 2010

2009-10 Scoring Chances on the Penalty-Kill, by Individual

Yesterday, I put up the chance statistics for the Leafs on the Power-Play. I was going to include the PK stats in that same post but for some reason the tables went screwy on me so I took the PK table out. Instead, I'll post that data here in JPEG form for skaters and goalies (click to read full-size).

Sjostrom and Phaneuf were solid additions to the PK, which saw a great improvement later in the season. The improvement was due to a combination of sending out a goalie who struggled mightily on the PK in exchange for one who caught fire (Giguere), and player personnel changes within the last one-third of the season with the bulk of icetime going to Sjostrom, Mitchell, Wallin, Hanson, Bozak at the forward positions.

Like I mentioned in the previous post, it's interesting to note that the worst PP in the league averaged 30.7 chances on the PP per 60 minutes, while the worst PK in the league averaged 43.0 chances against per 60. Perhaps both special teams should shoot for around 36.0 next season.

Penalty-Kill, Skaters:
Penalty-Kill, Goalies:

Sunday, April 18, 2010

2009-10 Power-Play Scoring Chances, by Individual

Throughout the 2009-10 season, I have tracked scoring chances for the Leafs in all but 9 games. Luckily, I have data for 3 of those games that I missed, supplied by bloggers who've tracked chances for other teams. Over the past week or so, I've been going over my data and doing some double-checking whenever I get some spare time, so some corrections were made.

In this post, we will look at the 2009-10 total scoring chance statistics for all Leaf players who played at least 1 second on the PP during the games covered, excluding two man advantage situations. A post containing penalty-killing data, and one on even-strength stats will soon follow, as well as one looking at high quality scoring chances.

The Leafs ranked last in both PP Scoring Percentage and Penalty-Killing Percentage, so we can approximately see both ends of the spectrum as far as how many chances NHL Power-Play's generate on average. Toronto averaged 30.7 chances per 60 minutes of power-play time, while the opposition averaged 43.0 chances per hour against the Leafs' PK. I was going to include penalty-kill data in this post but for some reason the tables were fudging up on me so I'm going to have work on fixing that up.

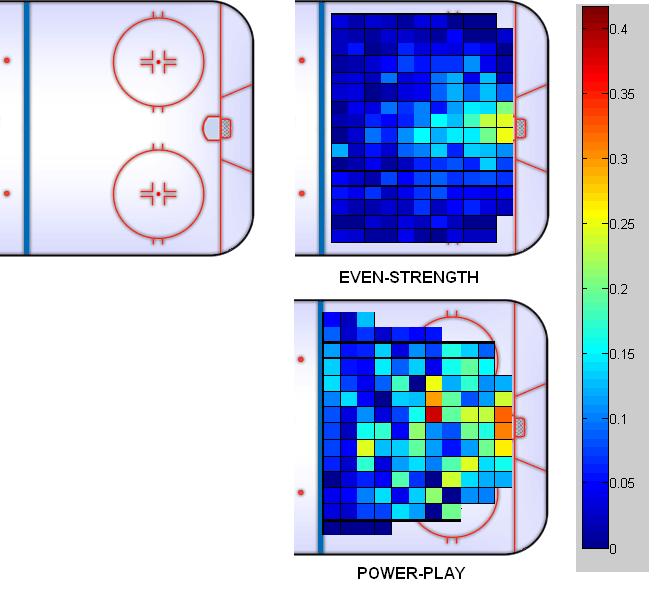
What I considered a scoring chance: a shot taken from within what I dubbed the "prime scoring area" - draw a line starting from the faceoff dots inside each circle and angle it inward toward the net. Most goals are scored within that region and the average shot attempt from inside those lines have a better probability of going into the net than a shot from almost anywhere outside that region (Gabriel Desjardins of Behind-the-Net posted this diagram awhile ago that demonstrates this). A shot from outside could also be considered a scoring chance, depending on certain conditions (traffic in front of the goal, if the goalie was well screened, rebound shots, etc.). I won't count a long-bomb shot if it doesn't hit the net, regardless of screens and whatnot, and I think that's one of the reasons why the Leafs horrifically stale PP suffered so much this season, too much reliance on low-percentage shots from the point, often missing the net entirely if they get through. Not to mention the turnovers that result...

I am just digesting these stats myself so I have no special insight to offer... without any further comment, here's the stats for each player while on the PP:

Power-Play:
PlayerGP
TOI
ChF
ChA
PP
CF/60
SH
CA/60
DIF
/60
N. Kadri
1
1.65
2
0
72.73
0
+72.63
M. Komisarek
308.62
5
0
34.82
0
+34.82
V. Stalberg
3657.65
35
3
36.43
3.12
+33.30
L. Caputi
1734.40
21
2
36.63
3.49
+33.14
L. Stempniak*
58155.58
92
12
35.48
4.63
+30.85
J. Mayers*
414.07
2
0
29.51
0
+29.51
T. Bozak
35119.02
64
6
32.26
3.02
+29.24
P. Kessel
68243.93
134
17
32.96
4.18
+28.78
T. Kaberle
76322.32
175
22
32.58
4.10
+28.48
J. Finger
3512.88
7
1
32.60
4.66
+27.94
M. Grabovski
53124.65
68
10
32.73
4.81
+27.92
M. Stajan*
51
133.17
68
7
30.64
3.15
+27.48
C. Gunnarsson
4174.42
36
2
29.03
1.61
+27.41
A. Ponikarovsky*
57150.55
71
7
28.30
2.79
+25.51
F. Beauchemin
76217.20
109
17
30.11
4.70
+25.41
N. Kulemin
73108.65
56
11
30.92
6.07
+24.85
I. White*
52102.65
47
7
27.48
4.09
+23.39
N. Hagman*
51103.10
47
7
27.35
4.07
+23.28
R. Wallin
547.82
3
0
23.03
0.00
+23.03
J. Mitchell
54
78.33
35
5
26.81
3.83
+22.98
J. Blake*
52
94.72
42
6
26.61
3.80
+22.80
L. Schenn
73
18.43
9
2
29.29
6.51
+22.78
J. Lundmark
14
11.38
5
1
26.35
5.27
+21.08
D. Phaneuf
24
99.02
42
10
25.45
6.06
+19.39
C. Orr
76
6.98
2
0
17.18
0
+17.18
C. Hanson
29
35.40
16
6
27.12
10.17
+16.95
W. Primeau
56
8.25
2
0
14.55
0
+14.55
G. Exelby
49
1.60
0
0
0
0
0
F. Sjostrom
18
3.98
0
0
0
0
0
J. Rosehill
12
0.65
0
0
0
0
0
B. Irwin
2
0.10
0
0
0
0
0
J. Tlusty*
2
2.77
0
0
0
0
0
Player
GP
TOI
ChF
ChA
PP
CF/60
SH
CA/60
DIF
/60
V. Toskala*
23
118.20
68
8
34.52
4.06
+30.46
J. MacDonald*
6
31.67
20
5
37.89
9.47
+28.42
J-S. Giguere
13
98.47
50
6
30.47
3.66
+26.81
J. Gustavsson
40
216.77
100
13
27.68
3.60
+24.08
All Goalies
76
465.10
238
32
30.70
4.13
+26.57

Players with asterisks (*) beside their name were traded.

Click here for Scoring Chances in Short-Handed Situations (4-on-5 and 3-on-4).

Wednesday, March 17, 2010

Leafs' PP % and PK % trends through 70 games

In this post, we'll review the Leafs Special Teams Percentages throughout the year in line chart form. Up first, the Power-Play.

PP % (click to enlarge):


The Maple Leafs' power-play started the season off fairly well, having produced at least a goal in seven of the first ten games, scoring 12 goals on 39 opportunities, helped greatly by going 5/10 against the Anaheim Ducks on Oct. 26/09. This would turn out to be the best 10-game stretch for the Leafs all season long. Since then they have been on a fairly steady decline, with a few small spikes here and there. Over their last 50 games, the Leafs have gone 22 for 194 for a lowly 11.3 % success rate, and in their last 10 are just 3 for 50 (6.0 %), with all 3 goals coming against the Oilers last Saturday. The Leafs had actually started to produce a bit with the man advantage in the previous 10 games.

PP percentages in 10-game segments:

Games 01-10: 12/39 = 30.8 %
Games 11-20: 8/41 = 19.5 %
Games 21-3o: 3/36 = 8.3 %
Games 31-40: 4/29 = 13.8 %
Games 41-50: 4/39 = 10.3 %
Games 51-60: 8/40 = 20.0 %
Games 61-70: 3/50 = 6.0 %

Now, a look at the PK chart.

PK % (click to enlarge):


The Maple Leafs' struggles on the PK this season have been well documented. As late as through January 12, the Leafs were killing off penalties at an atrocious 68.1 % rate after 47 games. Fortunes started to change around the time of the deals with Calgary and Anaheim. In the game prior to the deals, the Leafs killed off 6 of 6 penalties in the game against the Canucks, and they mostly have been competent since that game and after the trades. From that time on, the Leafs have killed off penalties at 84.9 % rate (allowing 8 goals off 53 penalties), despite having hit a bit of a road bump prior to last night's game against Ottawa. Toronto had been scored against on the PK in each of the previous six games.

Personnel changes have been made. Stajan, Stempniak, Hagman, Mayers, and White were all shipped out. Wayne Primeau, statistically the worst PKer on the team, now rarely sees the ice while the Leafs are shorthanded. Rickard Wallin and John Mitchell have been used much more often, the rookies Tyler Bozak and Christian Hanson have seen a fair amount of time on the PK, while newcomers Dion Phaneuf and Fredrik Sjostrom (when healthy) have logged the lions' share of icetime since they've joined the team.

PK percentages in 10-game segments (successful kills / Times Short-Handed):

Games 01-10: 26/41 = 63.4 %
Games 11-20: 34/42 = 81.0 %
Games 21-3o: 22/32 = 68.9 %
Games 31-40: 19/26 = 73.1 %
Games 41-50: 19/33 = 57.8 %
Games 51-60: 31/38 = 81.6 %
Games 61-70: 29/36 = 80.6 %

Wednesday, January 13, 2010

Special Teams Chances, through Games 6-46

I was going to post the individual scoring chances statistics a couple days ago but didn't get the chance to do a complete post. One post will be devoted to Special Teams, and other to chances during Even-Strength play. In this post, we will look at the stats on the Leafs ugly special teams' units.

All data is from games 6 to 46 (41 games, I missed the first five of the season).

First, the Power-Play:


Kessel and Stempniak are the best of an awful bad lot on the PP, and Stempniak is currently scoring a bit better than Kessel (3.43 points per 60 minutes at 5-on-4 for Stempniak to Kessel's 2.59) although Kessel sees slightly more goals on his shifts (5.69 to 5.39). Hagman and White rank lowest in Scoring-Chance-Differential (PPCA/60) amongst those who've seen extensive PP time.

Now for the Penalty-Kill:


I've already posted PK stats just a couple of days ago at Pension-Plan-Puppets, but now you can see data on all Leaf players as well as the regulars, with with data from last Saturday's game added in, and with a couple more stats to look at (chances for per 60 min and differential per 60).
I think we're all well aware of exactly how bad the Leafs PK is by now, but it looks like there is some hope here (!), if Wilson would just start using the right personnel more often.

Luke Schenn still looks one of the better options despite his high GAA but the PK save percentage behind him has been so poor that it can't possibly be all his fault. Stajan and Hagman have be the best forwards on the team at limiting chances, but Stempniak gives his differential a boost with his high rate of chances for while shorthanded. He has been on for 13 of the Leafs 19 shorthanded scoring chances, just behind Stajan's 14.

Saturday, December 19, 2009

Goalies and Penalty-Killing

Going into tonight's game against the Bruins, here is the PK breakdown on the Leaf goalies:


GPPP
GA
TSH
PK %
PP
SA
SVP
Toskala182056
64.3
88
0.773
Gustavsson
1710
48
79.2
800.875
MacDonald68
25
68.0310.742

Unsurprisingly, the stats are butt-ugly with Toskala in net and Joey Mac has struggled just as badly on the PK. With these two combined, the Leafs percentage of penalties killed off is a god awful 65.4 %. On the other hand, Gustavsson's 79.2 % would currently rank 19th in the NHL, bringing the Leafs up 11 places from their current ranking of dead last. Now, the Leafs skaters collectively haven't necessarily been great on the PK either (though I do I think they have the personnel who ought to be able to do the job), but competent goaltending would sure go a long way, and the numbers put up by Toskala in particular, as he is at least supposed to be a full-time NHL goalie, are inexcusable no matter what.

Toskala has faced 8 more shots on the PK than Gustavsson, and allowed twice as many goals. MacDonald has faced nearly half as much shots as Gustavsson, and has allowed almost as many goals. That's roughly 13 goals worse than what Gustavsson would've allowed, and about 10 worse than a goalie who stops PK shots at about the average rate. This poor performance in net while short-handed has cost the Leafs several points in the standings so far and hampered them in the race for a playoff spot.

EDIT:

A poster at Pension Plan Puppets asked about how much of an affect the Leafs poor start to the season had on Toskala's numbers. Here's a look at the month-by-month breakdown:

October: 8 PPGA, 20 TSH = 60.0 PK %
November: 3 PPGA, 15 TSH = 80.0 PK %
December: 9 PPGA, 21 TSH = 57.1 PK %

As you can see, Toskala has struggled just as badly on the PK in December as he did at the start of the season, after making progress in November.

Wednesday, December 2, 2009

Special Teams Scoring Chances, Games 6-25

Here's the scoring chances data for the Leafs special teams from games 6-25.

Power-Play:


The Leafs had the best ranking PP in the league for awhile but they have cooled off a good deal, as they now rank 10th in PP %, and haven't been generating much chances with the man advantage lately. I'm quite surprised to see Hagman ranking so low here.

Short-Handed:


Luke Schenn has the least amount of chances against per 60 of all regular PKers at 30.53, although his GAA isn't very pretty (8.55 after last night's game against the Canadiens: per Behind-the-Net), but I've been pleased with his play lately, he hasn't looked as shakey. Stempniak and Wallin are the other two regulars with a PPCA/60 under 40. Stajan has been on for 8 chances out of the 11 generated by the Leafs while short-handed, pretty impressive. Mayers has been hurting the Leafs on the PK again this season (as he has everywhere else except in the fisticuffs department), and Primeau and Exelby have been bleeding chances thus far (though luckily Exelby hasn't been on for a very high number of PP goals against).

Thursday, May 21, 2009

2008-09 Leafs Special Teams, and Drawing/Receiving Penalties

To the left is a table with Special Teams stats for NHL teams in 2008-09, including Net Goals For per 60 minutes of total game time ([ PP Goals For + SHGF ] / Total Minutes * 60), Net Goals Against per 60 min ([ PPGA + SHGA ] / Min *60), and Net Goal Differential at Special Teams per 60 (NGF/60 - NGA/60). Click to view the table at full size, that way you can actually read the data.

San Jose led the league in ND/60 at +0.44 followed by the Minnesota Wild at +0.40, and these two teams also ranked 2nd and 4th, respectively, at Opportunity Differential per 60 (OD/60). Not only were the Sharks and the Wild very effective at special teams but they got PP opportunities at a much greater rate than the opposition. On the flip side, Columbus and Tampa Bay finished 29th and 30th at ND/60. The two teams were very deficient at opposite ends of the spectrum, Columbus at scoring (0.59 NGF/60, worst in the NHL) and Tampa Bay at keeping the puck out of their net (1.17 NGA/60, 2nd last in the league and just a whisker ahead of the Thrashers). At OD/60, the Jackets ranked 25th (-0.3) and the Lightning 28th (-0.7). Anaheim and Philly tied for the worst OD/60 at -0.9. The Ducks had an awesome PP with a 21.0 % net efficiency percentage (which accounts for PP goals for and SH goals against) but had a mediocre PK, were one of the most penalized teams and were also among the teams given the least advantages per 60 minutes; the Flyers were strong on either side of the coin and had the 5th best net differential in the league.


As for the Maple Leafs, they were mediocre with the man advantage again, as their NGF/60 ranked 19th in each of the past two seasons, although they actually dropped from 9th to 11th in the Eastern Conference. They did improve their efficiency on the PP, as they went from 18th (14.9 PPNE %) in the NHL to 15th (16.7 %), and from 11th to 7th in the East despite losing a couple of their big PP guns in Sundin and McCabe. A lot of the credit would go to the additions of Grabovski, Kulemin, and Hagman plus the dramatic improvement in Blake's PP performance (he went from scoring 2.93 pts per 60 min of 5-on-4 play in '08 to 5.36 pts/60 in 09). Antropov and Poni scored at higher rates as well.

However, the Leafs continued to play horridly while short-handed, as the PK units' 76.6 % net efficiency was the worst in the NHL by nearly 2 %. This was also a -2.5 % decrease from the previous years' number. This past season, the Leafs NGA/60 was 5th from last in the league and their .825 save percentage against PP shots was dead last as well. The average save percentage on the PK in the NHL was .868 for 2008-09.

Yet, despite having the worst penalty-kill in the league, Toronto decreased their NGA/60 over the previous year's 1.05. Overall, they had the 24th ranked special teams Net Differential per 60 min, allowing -0.20 more goals against than they scored on special teams per regulation game. This is an improvement over their 2007-08 differential of -0.27, largely due to the decrease in the number of PP opportunities surrendered.

This table (click to view) shows data for Penalties Drawn/Taken strictly at Full-Strength for Leafs' players in 2008-09 on the left side, and 2007-08 on the right side (minimum 20 games, or about 1/4 of the season). These stats are courtesy of Behindthenet (which, I believe, leaves out coincidental penalties). Players who played 20+ games in both seasons and at least 50 % their games with the Leafs are in the top half, and the bottom half shows those who played 20+ in just one of the two seasons. Those in red italics were traded, those in blue were traded to the Leafs (or in Moore's case, claimed off waivers) during the season... their stats are from both teams. Steen is not included in either year, as he played 20 games for the Leafs in 2008-09 and then played 61 more games with St. Louis (and BtN doesn't have splits for traded players, so I left him off since he was a Blue for the vast majority of games played, unlike the other players who split time with multiple teams). He actually had the 2nd best penalties drawn/taken differential on the 2007-08 Leafs, tied with Tucker at +10, but Steen drew only 10 penalties this season compared to the 21 he drew for the Leafs the previous year and finished with a differential of -2 in '09.

The table shows that the newcomers had a much better penalties drawn/taken differential than those who departed over the off-season (or late during the 2007-08 season in two cases). The subtraction of Hal Gill (-15), Bryan McCabe (-17), Mark Bell (-11), and Andrew Wozniewski (-21), and the additions of Hagman (+18, with only 1 penalty at 5-on-5), John Mitchell (+13) and Lee Stempniak (+12) had a huge effect on this team's ability to "outdraw" the opposition. BTW, among all defensemen in the NHL who played at least a quarter of the season, Wozniewski had the 3rd highest rate of penalties received.

Interestingly, if you just take a look at the Leafs defencemen from that table, you'll find that this year's group posted a -27 differential, while the 2007-08 D had a whopping -93 differential! The returnees (Kabs, Kubina, White, and Stralman) collectively improved by +28; the group of new backend personnel were better than the departed by +38. Not only did the '09 group take less infractions (92 in '09, 131 in '08) but they drew more, too (65 in '09, 38 in '08). I'll bet Ron Wilson had something to do with it, after all look at how disciplined his old team in San Jose were and are. Prior to his arrival, they were regularly one of the most penalized teams in the league. The Sharks of '02 gave up 381 PPOs to the opposition, 3rd most in the NHL. After Wilson arrived on the scene to coach them for the remaining 3/4 the 2002-03 season, the Sharks improved that number to 17th overall in a year where the refs were mandated to crack down on obstruction. Then in 2003-04 they ranked 24th in Times Short-Handed, and ever since the lockout they've consistenly been in the top five for least PP advantages held by the opposition and earn a good chunk of their goal differential at Special Teams.

So it looks like the Leafs got that discipline thing down over the past year, now they really need to fix that darned penalty kill.